|
|
|
|
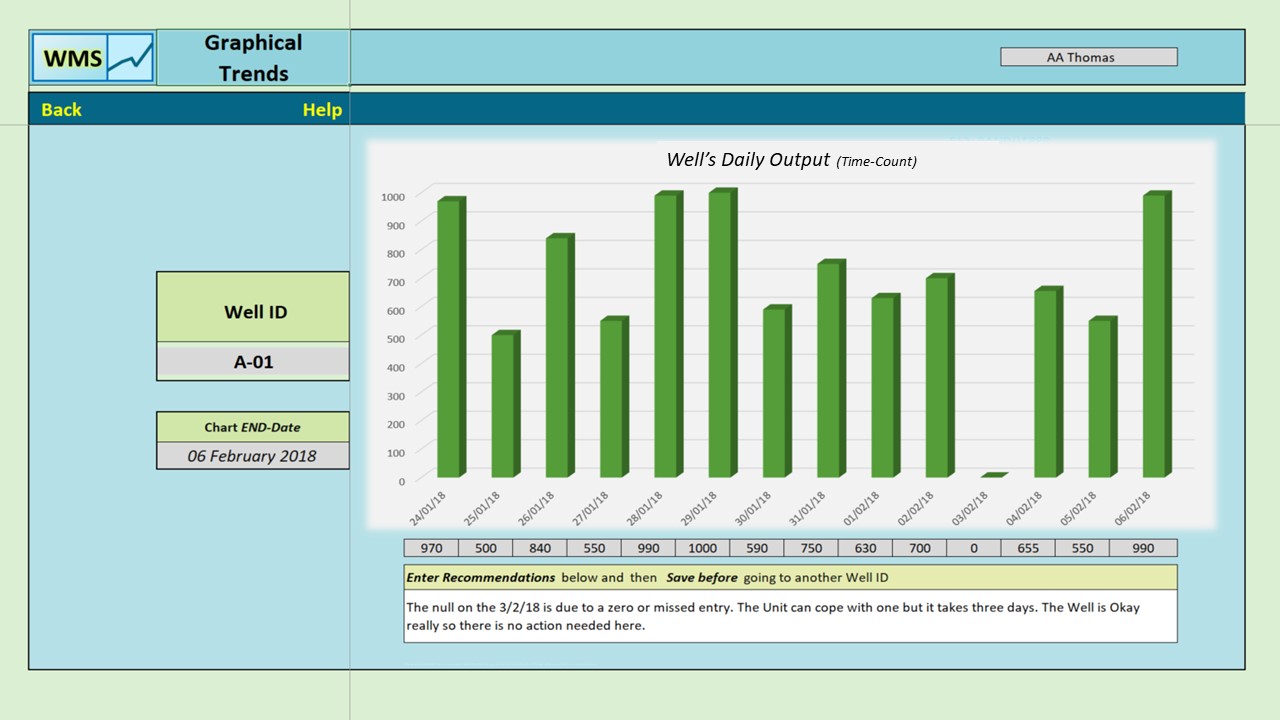
Analysis of the data is key. Interpretation of the charts and capturing User comments is a main output and central benefit of the AWSOM(TM) system.
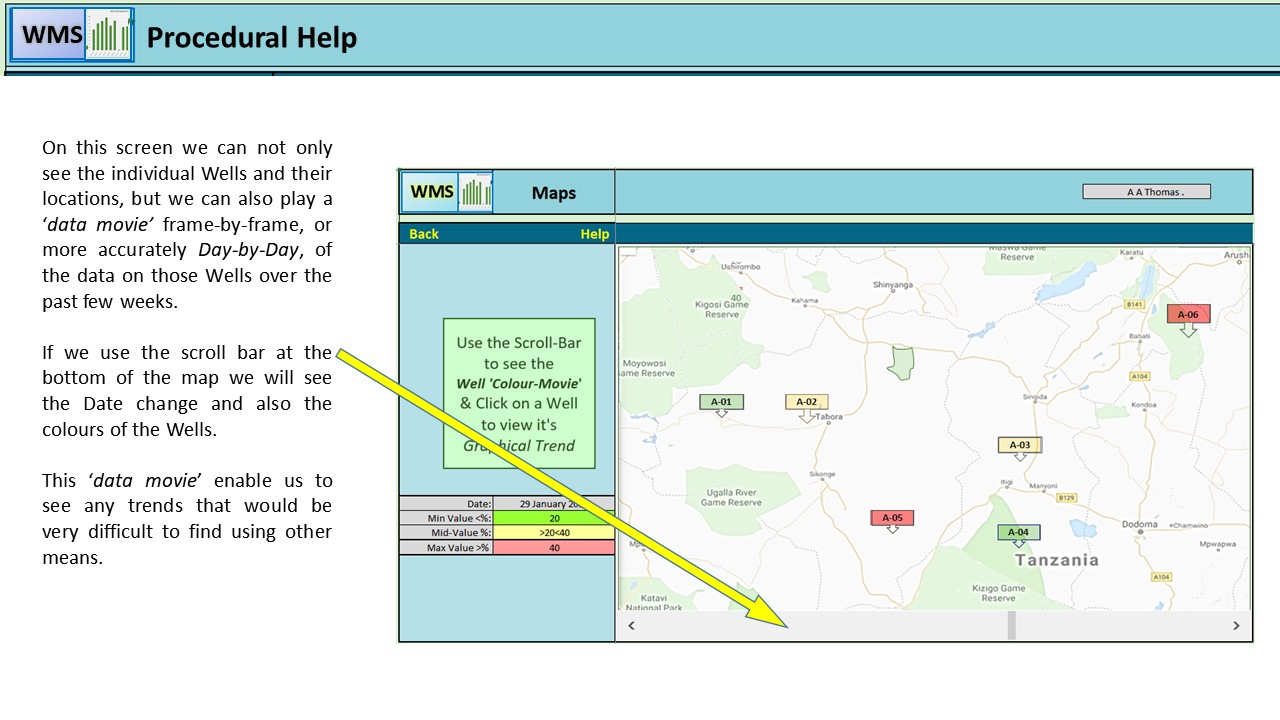
When, in the live Base Station, we use the scroll bar at the bottom of the map, we see the Date change and also the colours of each of the Wells.
This ‘data-movie’ enable us to see trends sweeping across or down the country. This trend would be very difficult to identify using other means.
Many more screens are available and can be provided upon request. (An AWSOM(TM) training system with a limited data-set is available free upon request) |
|
| Reviews | |
| * * * * * |
|
| < Home |
| ©2022 BTecNet . .. . Sponsored by:-:. Excelinbusiness.co.uk • BtecNet.co.uk |
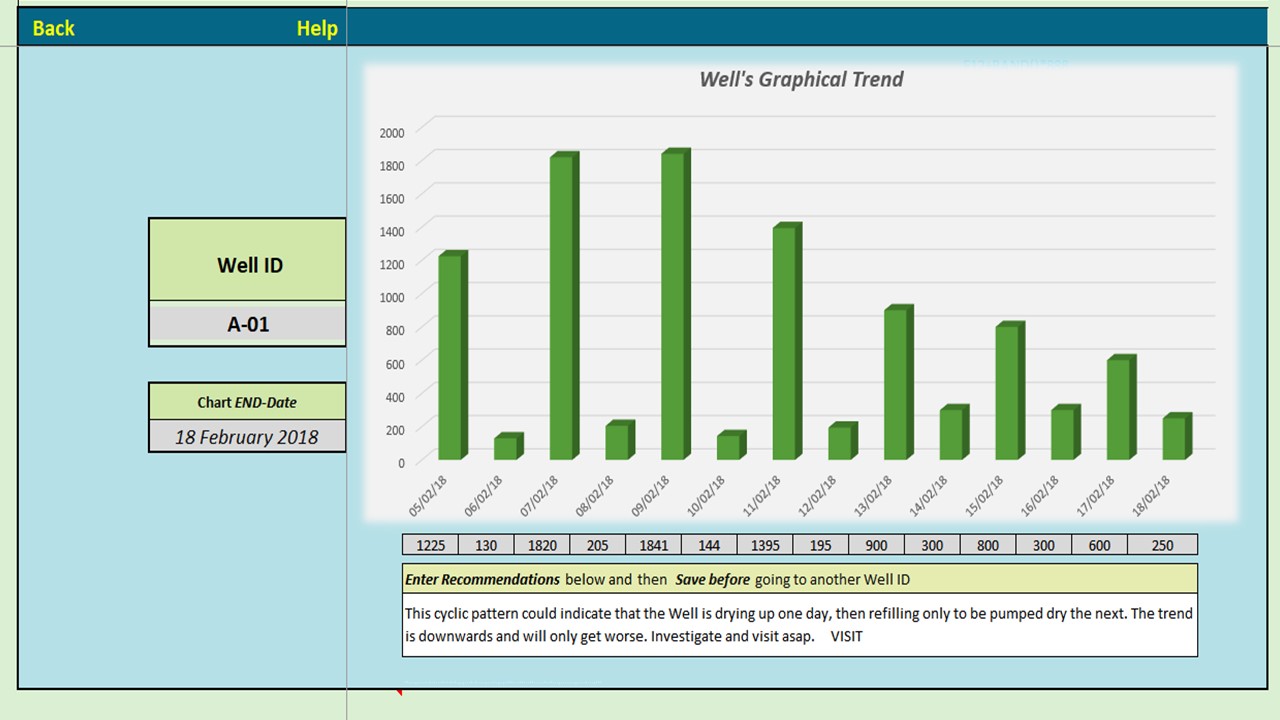 This
Well is predicted to fail and stop working next week. The cyclic
pattern could indicate that the Well is drying-up one day then
refilling the next only to be pumped dry the next. The trend is
This
Well is predicted to fail and stop working next week. The cyclic
pattern could indicate that the Well is drying-up one day then
refilling the next only to be pumped dry the next. The trend is